The latest Chameleon Benchmark Report is here! With data from 300 million in-product Experiences, we bring you the insights you need to scale your self-serve product.
Get the full report
“The number of negative emails, tweets, and support messages has dwindled and instead, we’ve seen a great increase in messages from happy customers since using Chameleon”
User engagement with Tours jumped 33% in 2021. Users of today expect a self-service experience, and the Benchmark Report reveals how to ensure UX is delightful.
Why did engagement jump so much? Here are a few reasons:
The 2022 Benchmark Report shows that the sophisticated use of Microsurveys is essential for increased customer engagement, and that users love to be heard.
Tooltips have been around for a while – but our Benchmark Report shows that they're more popular than ever: in July 2021 there were 273,487% more tooltips viewed compared to the same month in 2020!
And the 45% of Chameleon customers that use Tooltips use them extensively, with an average of 18 Tooltips per account.
The Benchmark Report shows how Chameleon customers use Tooltips to guide users as they navigate your app, validate and test product ideas, and other best practices.

A Launcher is a hugely versatile widget that can be used to access information, guides, and integrations.
But after analyzing the 395,000 opened Launchers, our Benchmark Report reveals that they're most often used to enable your users to take charge of their own product education, and on their own terms: the most common use cases this year were for "help" and "onboarding".
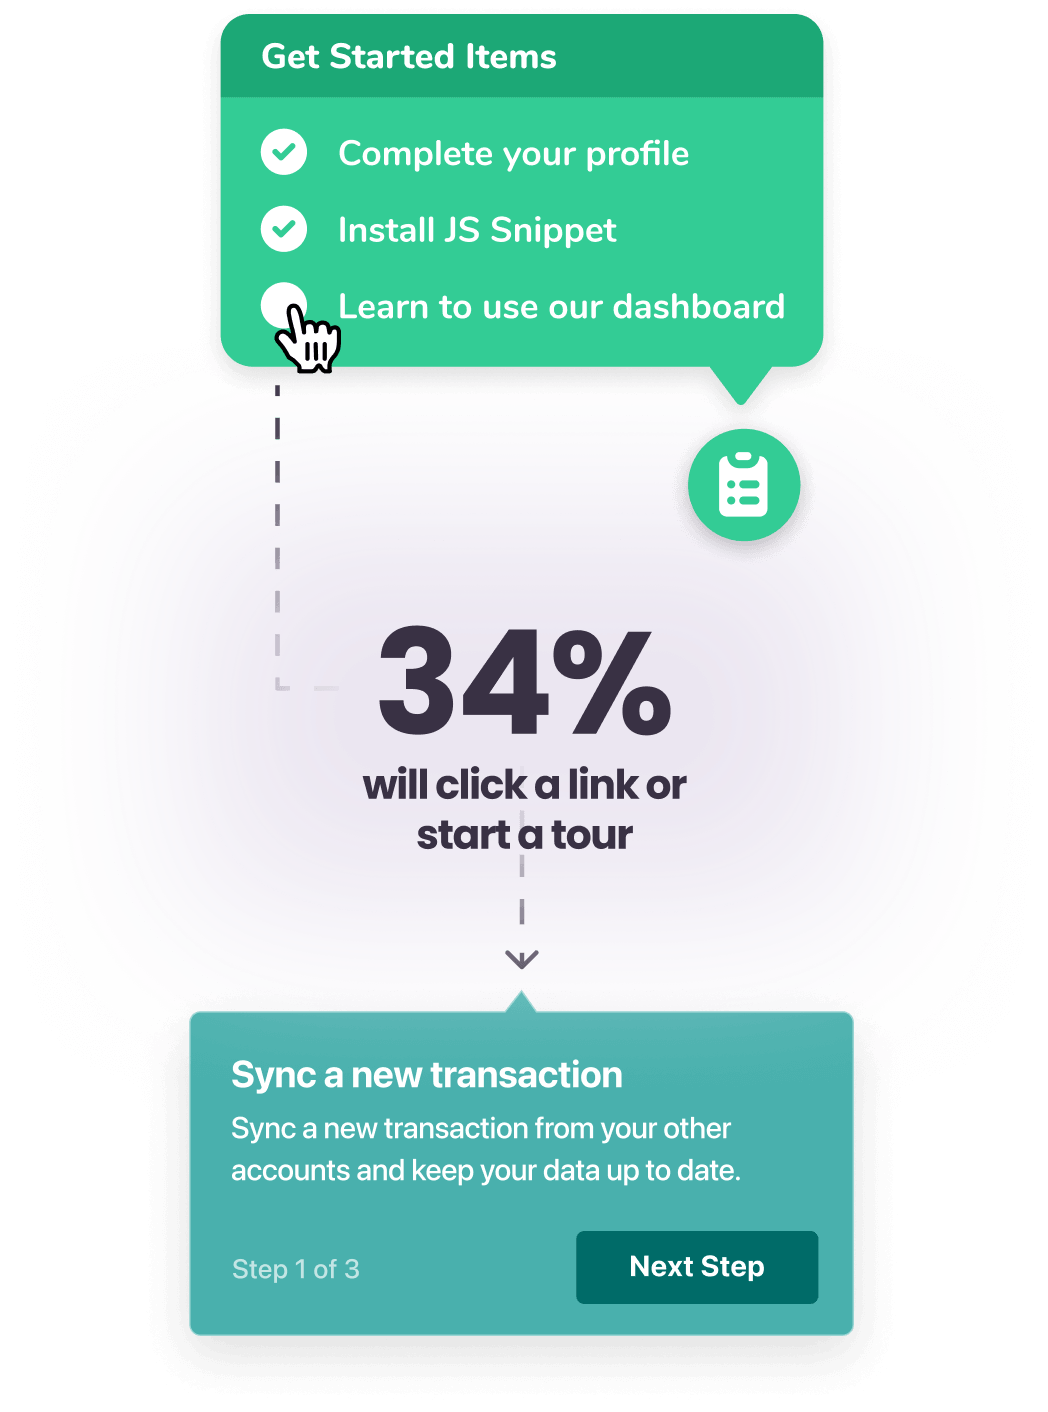
And Launchers are a highly effective educational tool, as 1 in 3 users who interact with a Launcher start a tour.
