


Ever tried signing up for a new SaaS tool but gave up halfway because you couldn’t find the “submit” button? That’s a classic example of user friction.
Friction logs keep track of these moments—when users feel stuck or confused—so you can see exactly where your product needs extra attention. By resolving these trouble spots, you deliver a smoother experience, boost retention, and support ongoing growth.
In this guide, we explain how friction logs work, show you how to prioritize the biggest pain points, and share tips for continuous product refinement. Ready to cut down on confusion and keep users satisfied? Let’s get started with this introduction to friction logging!
What are friction logs?
Friction logs are systematic records used to track user challenges within your product. Each log entry highlights a specific user interaction (or failed interaction) that signals a friction point—anything from a confusing onboarding screen to an underused feature.
By capturing these instances, you establish a data-driven foundation for user behavior analysis and product improvements. Friction logging supports the whole user experience: no guesswork, no assumptions—just clear, actionable insights that keep your product moving in the right direction.

Despite your users' motivation to take actions, when product friction exists—you'll be working harder to get them to that "aha moment"
Why friction logs matter
Friction logs go beyond traditional bug reports or user feedback. They let you track exactly where and why users struggle, providing clear, actionable product insights.
Key benefits of friction logs include:
User behavior tracking and analysis: Monitoring session recordings, heatmaps, or in-app events helps identify friction points more precisely. With friction logs, you can cross-reference each event with actual user actions, revealing how and when friction happens.
Turning insights into action: Connecting user behavior analysis with specific product changes reduces customer friction. Measure the impact of each fix, see if it resolves the friction, and refine your approach using product analytics tools.
Prioritized problem-solving: By exposing which issues affect users most, friction logs let you tackle high-impact problems first. This ensures resources are used strategically, improving user satisfaction faster.
Streamlined cross-team collaboration: Having a single source of truth for product hurdles empowers product, UX, and engineering teams to work from the same data, reducing guesswork and encouraging shared decision-making.
Increased user empathy: Friction logs develop user empathy amongst your team, enabling designers and developers to connect with users and the frustrations they face. It adds the user's context to product issues to get a more comprehensive view of how your team can support user success.
How to implement friction logs + a free friction log template
Ready, set, log! Download our simple friction log template to write a friction log today. 👇

Download your free friction log template
No email needed—just make a copy of the template and get started with your friction log in Google Docs.
1. Define key user journeys to analyze
Start by outlining critical user workflows, such as onboarding, feature adoption, or checkout. Each journey should have a clear goal—like activating a feature or completing a purchase. These goals guide your friction log process, making it easier to spot friction points that block user success.
💡 Check out our user onboarding tips to learn how to streamline key activation steps.
2. Gather data using product analytics tools
Choose product analytics tools (such as Mixpanel, Hotjar, or Chameleon’s in-app analytics) to track drop-offs, error rates, and time-on-task metrics. Identify where users abandon a workflow or spend excessive time. Each data point you collect contributes to friction logging—indicating exactly where user friction occurs.
💡 Learn more about in-app guidance solutions to guide users toward crucial product milestones.
3. Identify friction points through user behavior analysis
Analyze the data you’ve captured. Look for common patterns—like abandoned signup forms or repeated clicks (aka rage clicks) on a single element. Each pattern represents customer friction you can log, providing a blueprint for improvements.
💡 For deeper insights into understanding usability, see our guide on user journey mapping to uncover hidden friction points in the product experience.
4. Apply product analytics tools to measure impact and changes
Document your findings and log them systematically. Each friction log entry should include:
The friction point (e.g., a confusing button label)
Relevant data (e.g., drop-off rate, error messages, quantitative feedback)
Proposed solutions (e.g., change button text, adjust workflow)
Prioritize these friction points based on severity or user impact, then fix them. Continue referring to your product analytics tools to track how updates affect user behavior and reduce friction points over time.
5. Use friction logs for continuous improvement
Friction logs are not a one-and-done tactic—they’re part of an ongoing feedback loop to improve the overall user experience.
Iterative testing and refinement: After fixing a friction point, run A/B tests to confirm the improvement. If user friction persists, tweak and retest, then rinse and repeat.
Cross-functional collaboration: Share logs with product managers, UX designers, and engineers. A shared understanding of friction leads to data-backed and user-centric decisions about features, UI, and UX.
Where and how to store friction logs
Maintaining friction logs in a central, accessible format makes it easier for all teams to reference and update them. Use a simple spreadsheet, a project management tool (e.g., Trello or Jira), or a specialized product analytics platform. The key is to ensure everyone knows where to find this “source of truth” so they can quickly log new findings or check the status of existing friction points.
How often to review friction logs + pitfalls to avoid
Scheduling regular reviews—such as monthly or at the end of each sprint—helps you spot emerging patterns and decide if an issue is a one-off or part of a larger trend. If the same friction point shows up repeatedly across different user segments, it likely needs a higher priority.
Common pitfalls to avoid:
Don’t conflate friction logs with standard QA tickets: Bugs are typically technical errors, whereas friction logs highlight where the user experience breaks down—even if it’s not a bug.
Focus on user context: Understand not just that friction occurred, but why it happened. For example, if you see recurring friction in onboarding, consider whether the language or layout confuses new users.
Avoid “log and forget”: A friction log only adds value if the team actively follows through. Make sure your process includes next steps, owners, and timelines for resolving issues.
Friction log examples
Friction logs aren’t just theory—they offer real-world insight into where users get stuck. The following examples show how to spot specific issues in onboarding flows and feature discovery, and then use those findings to create better product experiences.
Let’s take a look at friction logs in action:
Onboarding bottlenecks
Let’s say a SaaS platform notices many new users bailing on the sign-up flow midway through. A friction log highlights where these people are getting stuck—maybe step three of five is never completed. After digging deeper into user behavior and feedback, the product team realizes the process feels too long and confusing, and is causing users to get frustrated and drop out of the onboarding flow.
By condensing and simplifying the sign-up flow and offering tooltips to guide users, they reduce customer friction and see a notable boost in conversions during onboarding.
💡 Learn how to optimize user onboarding to remove blockers and guide users seamlessly.
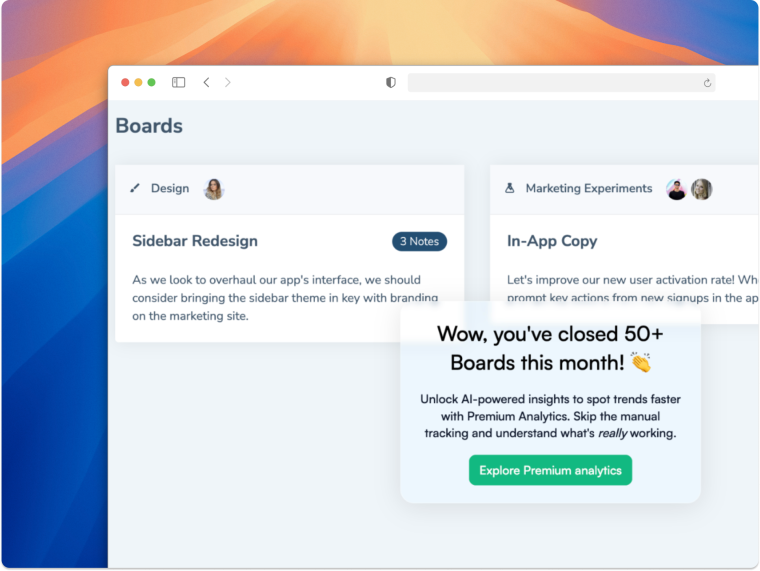
Feature discovery gaps
Let’s say another company has just rolled out a powerful new feature, but very few users interact with it. A friction log records repeated feedback and data points showing people miss the feature entirely. After investigating further—with user interviews, surveys, or session recordings—the team realizes there’s not enough in-app direction. People simply aren’t aware the feature exists.
By updating the UI and adding an in-app tutorial, the team can make the feature more visible, leading to higher product adoption and overall retention.
💡 Dive into feature adoption best practices to help users find and embrace new features and your product’s core functionality.
Now consider an e-commerce platform noticing that many shoppers abandon their carts late in the checkout process. A friction log highlights where customers get stuck—right after they see a confusing shipping menu. After reviewing session recordings and user feedback, the team realizes customers don’t understand shipping options or costs until too far into the checkout flow.
The team updates the checkout flow to highlight shipping times and costs upfront. By surfacing the shipping times and fees earlier and clarifying each option, they see fewer drop-offs and improved conversion rates.

A real-world friction log in the wild. Make this friction log your own—click here to make your copy.
From friction logs to product growth: using Chameleon to resolve friction
A friction log captures the end-to-end product experience—it provides a broad picture based on real customer experiences. The goal of creating friction logs is to capture the entire user experience and identify opportunities for improvement.
Friction logs can transform your product from frustrating to intuitive—especially when you have the right tools. With Chameleon, you can deploy targeted tooltips, product tours, or embeddable cards at known friction points, helping users overcome hurdles in real-time.
Use dynamic content that adapts to changing user behavior, ensuring customer friction remains low—even as your product evolves. By leveraging product analytics tools alongside Chameleon’s features, you can continuously refine user journeys, boost engagement, and unlock sustainable product growth.
Ready to leave friction behind for good? Combine friction logs with Chameleon’s no-code features to keep users satisfied, engaged, and coming back for more.


